Plot(): A pyplot.plot() function Plot horizontal versus vertical coordinates of the data points as lines and/or markers.
Parameters:
- x,y : array-like or scalar. x values are optional and default to
range(len(y)). - fmt : str (Optional). settings for line properties. E.g ‘ro’ for red circle
- data : indexable Object(Optional). An Object with labelled data.
- Plot function also has other beautification parameters like a line label, line width, marker face color, etc.
fmt: Format string consists of a part for color, marker and line. Each of them is optional.
fmt = '[marker][line][color]' or '[color][marker][line]'
Markers
|
Colors
|
||||||||||||||||||||||||||||||||||||||||||||||||||||||||||||||||
Line Styles
|
Examples:
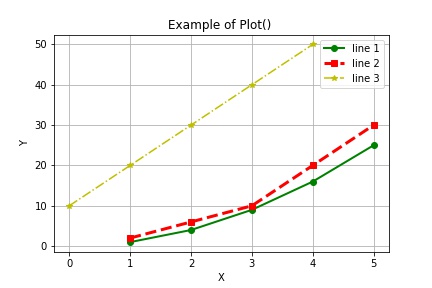
import matplotlib.pyplot as plt

plt.plot([1,2,3,4,5], [1,4,9,16,25], 'go-', label='line 1', linewidth=2)
plt.plot([1,2,3,4,5], [2,6,10,20,30], 'rs--', label='line 2', linewidth=3)
plt.plot([10,20,30,40,50], 'y*-.', label='line 3')

plt.title("Example of Plot() ")
plt.xlabel("X")
plt.ylabel("Y")
plt.grid(True)
plt.legend()
plt.savefig("plot_example.jpg")
This produces the following result: