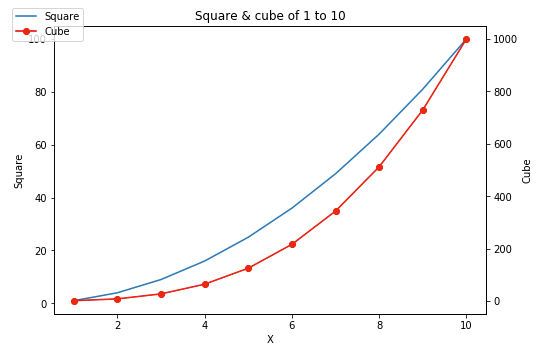
It is quite useful to have dual x or y-axes in a figure when plotting graph with different units together. Matplotlib provides this with the twinx and twiny methods. Below is the example of twinx of sharing x-axis.
Example:
import matplotlib.pyplot as plt
import numpy as np

x = np.arange(1,11)

fig = plt.figure()
a1 = fig.add_axes([0,0,1,1])
a1.set_title("Square & cube of 1 to 10")

a1.plot(x,np.power(x,2))
a1.set_ylabel('Square')

a2 = a1.twinx()
a2.plot(x, np.power(x,3),'ro-')
a2.set_ylabel('Cube')
a1.set_xlabel("X")
fig.legend(labels = ('Square','Cube'),loc=2)
plt.show()
This draws the following graph:
. . .