The subplot2grid method allows us to plot multiple diagrams on a single figure. The subplot2grid method is similar to subplot() method, but subplot2grid provides a more compact structure for multiple plotting. A subplot() method does not give freedom to plot the graph at some specific place, however subplor2grid method provides customization to choose specific space to plot the graph.
In this tutorial, you will discover the examples of subplot2grid.
pyplot.subplot2grid : Create an axis at a specific location inside a regular grid.
Parameters :
- shape : Shape of grid in which to place axis. First entry is number of rows, second entry is number of columns.
- loc : Location to place axis within grid. First entry is row number, second entry is column number.
- rowspan : Number of rows for the axis to span to the right.
- colspan : Number of columns for the axis to span downwards.
Example 1
import matplotlib.pyplot as plt
import numpy as np

x = np.arange(1,11)

fig = plt.figure(figsize=(10,6))
fig.suptitle("Example of subplot2grid")

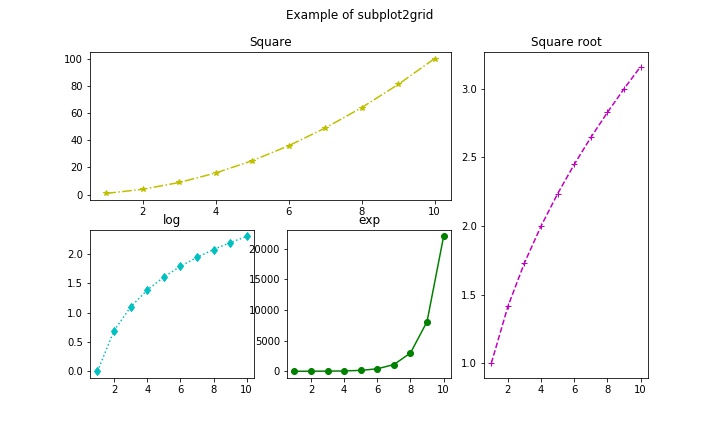
ax1 = plt.subplot2grid((2, 3), (0, 0), colspan=2)
ax2 = plt.subplot2grid((2, 3), (0, 2), rowspan=2)
ax3 = plt.subplot2grid((2, 3), (1, 0))
ax4 = plt.subplot2grid((2, 3), (1, 1))

ax1.plot(x,np.power(x,2),'y*-.')
ax1.set_title("Square")

ax2.plot(x,np.sqrt(x),'m+--')
ax2.set_title("Square root")

ax3.plot(x,np.log(x),'cd:')
ax3.set_title("log")

ax4.plot(x,np.exp(x),'go-')
ax4.set_title("exp")

plt.show()
This draws the following figure.

Example 2
import matplotlib.pyplot as plt
import numpy as np

x = np.arange(1,11)

fig = plt.figure(figsize=(12,10))
fig.suptitle("Example of subplot2grid")

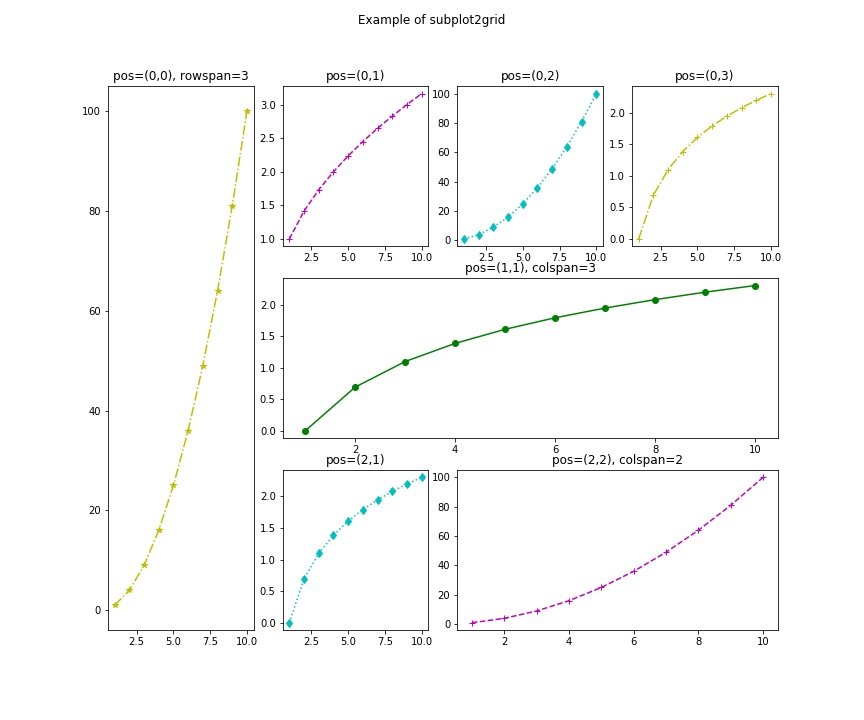
ax1 = plt.subplot2grid((3, 4), (0, 0),rowspan=3)
ax2 = plt.subplot2grid((3, 4), (0, 1))
ax3 = plt.subplot2grid((3, 4), (0, 2))
ax4 = plt.subplot2grid((3, 4), (0, 3))

ax5 = plt.subplot2grid((3, 4), (1, 1),colspan=3)

ax6 = plt.subplot2grid((3, 4), (2, 1))
ax7 = plt.subplot2grid((3, 4), (2, 2), colspan=2)

ax1.plot(x,np.power(x,2),'y*-.')
ax1.set_title("pos=(0,0), rowspan=3")

ax2.plot(x,np.sqrt(x),'m+--')
ax2.set_title("pos=(0,1)")

ax3.plot(x,np.power(x,2),'cd:')
ax3.set_title("pos=(0,2)")

ax4.plot(x,np.log(x),'y+-.')
ax4.set_title("pos=(0,3)")

ax5.plot(x,np.log(x),'go-')
ax5.set_title("pos=(1,1), colspan=3")

ax6.plot(x,np.log(x),'cd:')
ax6.set_title("pos=(2,1)")

ax7.plot(x,np.power(x,2),'m+--')
ax7.set_title("pos=(2,2), colspan=2")

plt.show()
This produces the following result:

. . .