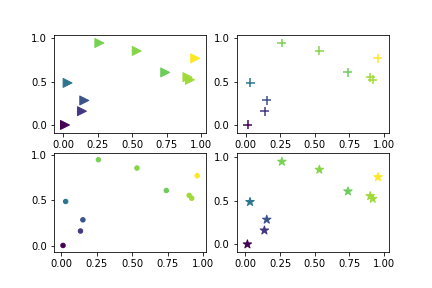
A pyplot.subplot method adds a subplot to the current figure. You can add subplot using two ways.
1. subplot(nrows, ncols, index, **kwargs)
2. subplot(pos, **kwargs)
In the first syntax, three parameters nrows, ncols and index define the position of the subplot.
In the second syntax, pos is a three-digit integer, where the first digit defines a number of rows, the second digit define the number of columns, and the last third digit define an index of the subplot.
Different ways to use subplot:
plt.subplot(221)
ax1=plt.subplot(2, 2, 1)  # equivalent but more general

ax2=plt.subplot(222, frameon=False)  # add a subplot with no frame

plt.subplot(223, projection='polar') # add a polar subplot

#  add a red subplot that shares the x-axis with ax1
plt.subplot(224, sharex=ax1, facecolor='red')

plt.delaxes(ax2) # delete ax2 from the figure

plt.subplot(ax2) # add ax2 to the figure again
Example
import numpy as np
import matplotlib.pyplot as plt
np.random.seed(12)

x = np.random.rand(10)
y = np.random.rand(10)
z = np.sqrt(x**2 + y**2)

plt.subplot(221)
plt.scatter(x, y, s=80, c=z, marker=">")
plt.subplot(222)
plt.scatter(x, y, s=80, c=z, marker="+")
plt.subplot(223)
plt.scatter(x, y, s=80, c=z, marker='.')
plt.subplot(224)
plt.scatter(x, y, s=80, c=z, marker="*")
plt.show()
This produces the following result:

. . .
pyplot.subplots
The pyplot.subplots create a figure and a set of subplots. It creates common layouts of all subplots.
Example
import matplotlib.pyplot as plt

data = {'apples': 10, 'oranges': 15, 'lemons': 5, 'limes': 20}
names = list(data.keys())
values = list(data.values())

fig, axs = plt.subplots(1, 3, figsize=(10, 4), sharey=True)

axs[0].set_title('Bar Plot')
axs[0].bar(names, values)

axs[1].set_title('Scatter Plot')
axs[1].scatter(names, values)

axs[2].set_title('Line Plot')
axs[2].plot(names, values)
fig.suptitle('Categorical Plotting')
This produces the following results:

. . .