Logistic regression is used when the target variable is categorical. It is a classification algorithm used to assign a sample to a specific class. The main difference between linear regression and logistic regression is that linear regression predicts the continuous value where Logistic regression apply the sigmoid function to its output and return a probability value and later it mapped to discrete class.
Example:
Linear Regression :
- Predict the sale price of the house
- Predict student’s exam score
- Predict share market’s movements
Logistic Regression :
- Classify ticket type such as first-class, second class, etc.
- Predict the sentiment of the text
- Classify season such as winter, summer, monsoon.
. . .
Sigmoid activation function
The sigmoid function looks like a S-shape. The sigmoid function used to map predicted value to probabilities between 0 and 1 in Logistic Regression.
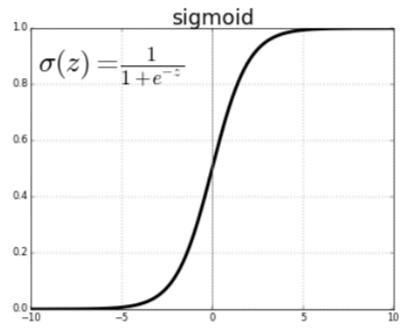
The mathematical equation of a sigmoid activation function is:
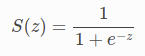
Where,
- s(z) = output between 0 and 1 (probability estimate)
- z = input to the function (your algorithm’s prediction e.g. mx + b)
- e = base of natural log
. . .
Predicting target variable
As we know the Logistic Regression returns the probability of test samples being positive. Probability close to 1, the model is more confident that the test sample is in class 1.
For example, Let’s have the data which contain patients’ thyroid test report. If the model returns 0.85, means that the patient has thyroid positive with 85% chances. And If the model return 0.3, means the patient has only 30% chances of the thyroid. we can consider that the patient hasn’t suffered from thyroid.
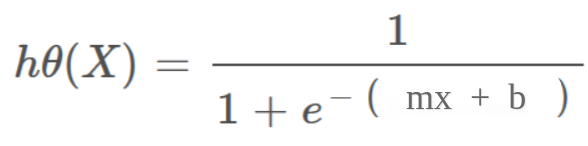
Hypothesis representation of Linear Regression:
hΘ(x) = mx + b
Hypothesis representation of Logistic Regression:
hΘ(x) = sigmoid(mx + b)
. . .
Cost function
The cost function represents optimization objective. Cross-Entropy function is used as a cost function in Logistic Regression. It is also known as Log Loss function. The cross-entropy cost function can be divided into two separate cost function for class 1 and class 0.
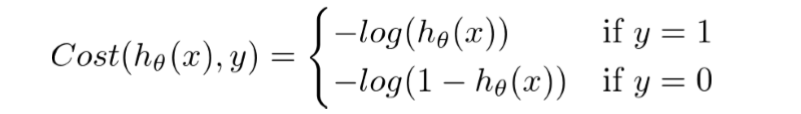

The above two cost function can be composed into one function:

- If y=0, the first part cancels out in summation.
- If y=1, the second part will cancel out, as (1-y) will be a zero.
. . .
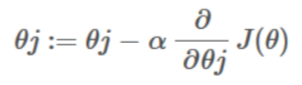
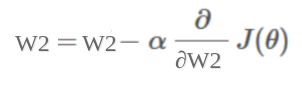
Gradient descent
Gradient descent is a method of updating the weight coefficient iteratively in order to minimize the cost function by calculating the gradient of it. Gradient descent in Logistic Regression works similarly as Linear Regression, the difference is only the hypothesis function. However, the derivative of the Logistic regression is complicated. To minimize the cost function, we need to apply gradient descent function on each parameter.
. . .
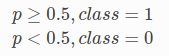
Mapping probabilities to classes
Logistic Regression returns the probabilities between 0 and 1. we need to select a specific threshold value to map probability to discrete class.
For example, Let’s select the threshold value as 0.5. The probability is greater than or equal to 0.5 lead to class 1 and the probability is less than 0.5 lead to class 0.
Ex: our Logistic regression model returned 0.2 probability for predicting cancer. We would classify this observation as a negative class.
. . .
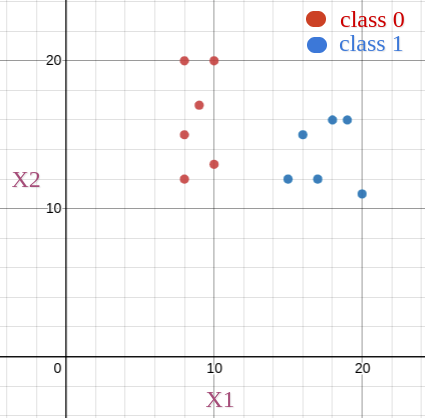
Example
| Width(W) | Height(H) | target |
| 10 | 20 | 0 |
| 8 | 15 | 0 |
| 20 | 11 | 1 |
| 9 | 17 | 0 |
| 17 | 12 | 1 |
| 10 | 13 | 0 |
| 18 | 16 | 1 |
| 16 | 15 | 1 |
| 8 | 12 | 0 |
| 8 | 20 | 0 |
| 15 | 12 | 1 |
| 19 | 16 | 1 |
Let’s plot the data points:
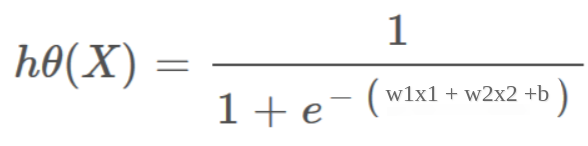
Hypothesis Representation:
hΘ(x) = σ(w1x1 + w2x2 + b)
Update coefficient by calculating the gradient of the cost function:


We do not need to write an entire implementation of Logistic Regression, as Scikit-Learn python package provides the implementation of Logistic Regression algorithm.
. . .