In this tutorial, you will get to know about missing values or NaN values in a DataFrame. The real-life dataset often contains missing values. For Data analysis, it is a necessary task to know about the data that what percentage of data is missing?
Let’s create a Pandas DataFrame that contains missing values.
import pandas as pd
import numpy as np

data = {'Id':[1, 2, 3, 4, 5, 6, 7, 8, 9, 10],
        'Name':['Mark', 'Juli', 'Alexa', 'Kevin', 'John', 'Devid', 'Mary', 'Michael', 'Johnson', 'Mick'],
        'Age':[27, 31, 45, np.nan, 34, 48, np.nan, 25, np.nan, 40],
        'Location':['USA', 'UK', np.nan, 'France', np.nan, 'USA', 'germany', np.nan, np.nan, 'Italy']}

df = pd.DataFrame(data)
df.head(10)
Output:
   Id     Name   Age Location
0   1     Mark  27.0      USA
1   2     Juli  31.0       UK
2   3    Alexa  45.0      NaN
3   4    Kevin   NaN   France
4   5     John  34.0      NaN
5   6    Devid  48.0      USA
6   7     Mary   NaN  germany
7   8  Michael  25.0      NaN
8   9  Johnson   NaN      NaN
9  10     Mick  40.0    Italy
Missing Data
Pandas provides pd.isnull() method that detects the missing values. It returns the same-sized DataFrame with True and False values that indicates whether an element is NA value or not.
NA values – None, numpy.nan gets mapped to True values. Everything else gets mapped to False values.
Example:
>>> pd.isnull(123)
False

>>> pd.isnull(np.nan)
True

>>> pd.isnull(None)
True

>>> df = pd.DataFrame([['abc', 'bee', np.nan], [1, None, 3]])
>>> df
     0     1    2
0  abc   bee  NaN
1    1  None  3.0

>>> pd.isnull(df)
       0      1      2
0  False  False   True
1  False   True  False
Let’s defined the function that calculates the missing value for each column in a DataFrame.
# Function to count missing values for each columns in a DataFrame
def missing_data(data):
    # Count number of missing value in a column
    total = data.isnull().sum()

    # Get Percentage of missing values
    percent = (data.isnull().sum()/data.isnull().count()*100)
    temp = pd.concat([total, percent], axis=1, keys=['Total', 'Percent(%)'])

    # Create a Type column, that indicates the data-type of the column.
    types = []
    for col in data.columns:
        dtype = str(data[col].dtype)
        types.append(dtype)
    temp['Types'] = types

    return(np.transpose(temp))
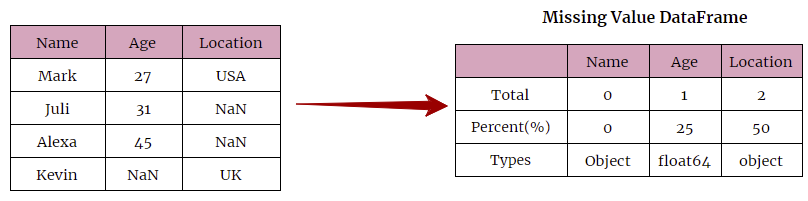
missing_data(df)
Output:
               Id    Name      Age Location
Total           0       0        3        4
Percent(%)      0       0       30       40
Types       int64  object  float64   object
. . .