A groupby operation involves some combination of splitting the object, applying a function, and combining the results. This can be used to group large amounts of data and compute operations on these groups. This tutorial has explained to perform the various operation on DataFrame using groupby with example.
In [1]:
# Let's define the DataFrame
import pandas as pd
data = {'item' :['tea','coffee','sugar','tea','coffee','sugar','tea','coffee','sugar'],
        'year':[2010,2010,2010,2011,2011,2011,2012,2012,2012],
        'sales':[1200,1050,500,1500,1200,1000,1230,1300,1420]}
df = pd.DataFrame(data,columns=['item','year','sales'])
df
Out[1]:
     item  year  sales
0     tea  2010   1200
1  coffee  2010   1050
2   sugar  2010    500
3     tea  2011   1500
4  coffee  2011   1200
5   sugar  2011   1000
6     tea  2012   1230
7  coffee  2012   1300
8   sugar  2012   1420
Split Data into Groups
Pandas object can be split into a group in many ways. A groups method is used to list group data.
Groupby using single column – It makes the group by using a single column.
In [2]:
item_group = df.groupby('item')
item_group.groups

Out[2]:
{'tea': Int64Index([0, 3, 6], dtype='int64'),
 'sugar': Int64Index([2, 5, 8], dtype='int64'),
 'coffee': Int64Index([1, 4, 7], dtype='int64')}
Groupby using multiple columns – It forms the group by using multiple columns.
In [3]:
item_group_multi = df.groupby(['item','year'])
item_group_multi.groups

Out[3]:
{('coffee', 2012): Int64Index([7], dtype='int64'),
 ('sugar', 2012): Int64Index([8], dtype='int64'),
 ('coffee', 2011): Int64Index([4], dtype='int64'),
 ('tea', 2012): Int64Index([6], dtype='int64'),
 ('sugar', 2010): Int64Index([2], dtype='int64'),
 ('tea', 2011): Int64Index([3], dtype='int64'),
 ('coffee', 2010): Int64Index([1], dtype='int64'),
 ('tea', 2010): Int64Index([0], dtype='int64'),
 ('sugar', 2011): Int64Index([5], dtype='int64')}
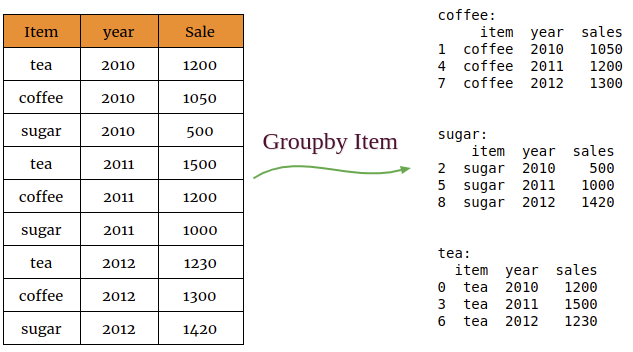
Iterating through Groups
You can also print the group elements by iterating through groups using for loop.
In [4]:
for name,group in item_group:
    print('{}:'.format(name))
    print(group)

Out[4]:
coffee:
     item  year  sales
1  coffee  2010   1050
4  coffee  2011   1200
7  coffee  2012   1300
sugar:
    item  year  sales
2  sugar  2010    500
5  sugar  2011   1000
8  sugar  2012   1420
tea:
  item  year  sales
0  tea  2010   1200
3  tea  2011   1500
6  tea  2012   1230
Selecting a Group
The get_group() method is used to select a particular group.
In [5]: item_group.get_group('coffee')
Out[5]:
     item  year  sales
1  coffee  2010   1050
4  coffee  2011   1200
7  coffee  2012   1300
Groupby – Aggregations
You can use aggregation function such as mean, sum, etc to get the aggregate value of each group. Aggregation functions are used once the group by object is created.
Example: Let’s calculate the average sales of each item.
In [6]:
agg_group = df.groupby('item')['sales'].mean()
agg_group

Out[6]:
item
coffee    1183.333333
sugar      973.333333
tea       1310.000000
Name: sales, dtype: float64
Aggregation group for Multiple columns – You can make groups for aggregation value by using multiple columns
Example: Let’s calculate the average and total sales of each item.
In [7]:
import numpy as np
agg_group = df.groupby('item')['sales'].agg([np.mean,np.sum])
print(agg_group)

Out[7]:
               mean   sum
item
coffee  1183.333333  3550
sugar    973.333333  2920
tea     1310.000000  3930

In [8]:
import numpy as np
agg_group = df.groupby('item')['sales'].agg(COUNT='count',Standard_deviation=np.std)
agg_group

Out[8]:
        COUNT  Standard_deviation
item
coffee      3          125.830574
sugar       3          460.579345
tea         3          165.227116
Filtration
The filter method returns a subset of the original object. Suppose we want to find the item, which is sale for less than three years.
In [9]:
# Let's define a DataFrame
import pandas as pd
data = {'item' :['tea','coffee','sugar','tea','coffee','sugar','tea','coffee'],
        'year':[2010,2010,2010,2011,2011,2011,2012,2012],
        'sales':[1200,1050,500,1500,1200,1000,1230,1300]}
df = pd.DataFrame(data,columns=['item','year','sales'])
df

Out[9]:
     item  year  sales
0     tea  2010   1200
1  coffee  2010   1050
2   sugar  2010    500
3     tea  2011   1500
4  coffee  2011   1200
5   sugar  2011   1000
6     tea  2012   1230
7  coffee  2012   1300

In [10]: df.groupby('item').filter(lambda x: len(x) < 3 )
Out[10]:
    item  year  sales
2  sugar  2010    500
5  sugar  2011   1000
. . .