Random forest is a supervised machine learning algorithm which works by building a series of Decision Trees. A random forest is a meta estimator that fits a number of decision tree classifiers on various sub-samples of the dataset and uses averaging to improve the predictive accuracy and control over-fitting. Random forest algorithm is used for both classification regression problem.
If you don’t have sufficient knowledge of Deciosn Tree, please refer to this tutorial of Decision Tree. As Decision Tree is the building block of Random forest, you should aware of how Decision Tree works.
Scikit-Learn library provides the implementation of the Random Forest algorithm. It provides a variety of parameters. This tutorial has explained about how Random forest work with an example.
Let’s built a Random Forest classifier on real-life data and visualize how a tree looks like. The Data contain the height and width of the house in square feet and need to predict the shape of the house such as regular or irregular. Here the target variable is binary:
Target :
- 0 – Irregular shape of a house
- 1 – Regular shape of a house
| Width(W) | Height(H) | target |
| 5 | 5 | 1 |
| 4 | 3 | 1 |
| 1 | 5 | 0 |
| 9 | 7 | 1 |
| 2 | 7 | 0 |
| 6 | 5 | 1 |
| 9 | 3 | 0 |
| 8 | 4 | 0 |
Let’s create a Random Forest classifier on the above data using Scikit-Learn library.
from sklearn.ensemble import RandomForestClassifier
from sklearn.tree import export_graphviz
import pandas as pd
import numpy as np
import graphviz

model = RandomForestClassifier(n_estimators=10)
data={'h':[5,3,5,7,5,7,3,4],'w':[5,4,6,9,1,2,9,8],'target':[1,1,1,1,0,0,0,0]}
df = pd.DataFrame(data)
df = df.sample(8)

train_x = df.drop('target',axis=1)
train_y = df['target']
model.fit(train_x,train_y)
Visualization a Tree
Here, the Random forest classifier built 10 trees with random samples, as we have passed the value of n_estimator is 10. Let’s see the graphical visualization of the first tree of Random forest. Please refer this tutorial for a detailed understanding of visualizing tree using Scikit-learn library.
#Visualization of tree
estimator = model.estimators_[0]

# Export as dot file
export_graphviz(estimator, out_file='tree1.dot',
                feature_names = ['h','w'],
                class_names = ['0','1'],
                rounded = True, proportion = False,
                precision = 2, filled = True)

# Convert to png using system command (requires Graphviz)
from subprocess import call
call(['dot', '-Tpng', 'tree1.dot', '-o', 'tree1.png', '-Gdpi=600'])

# Display in jupyter notebook
from IPython.display import Image
Image(filename = 'tree1.png')
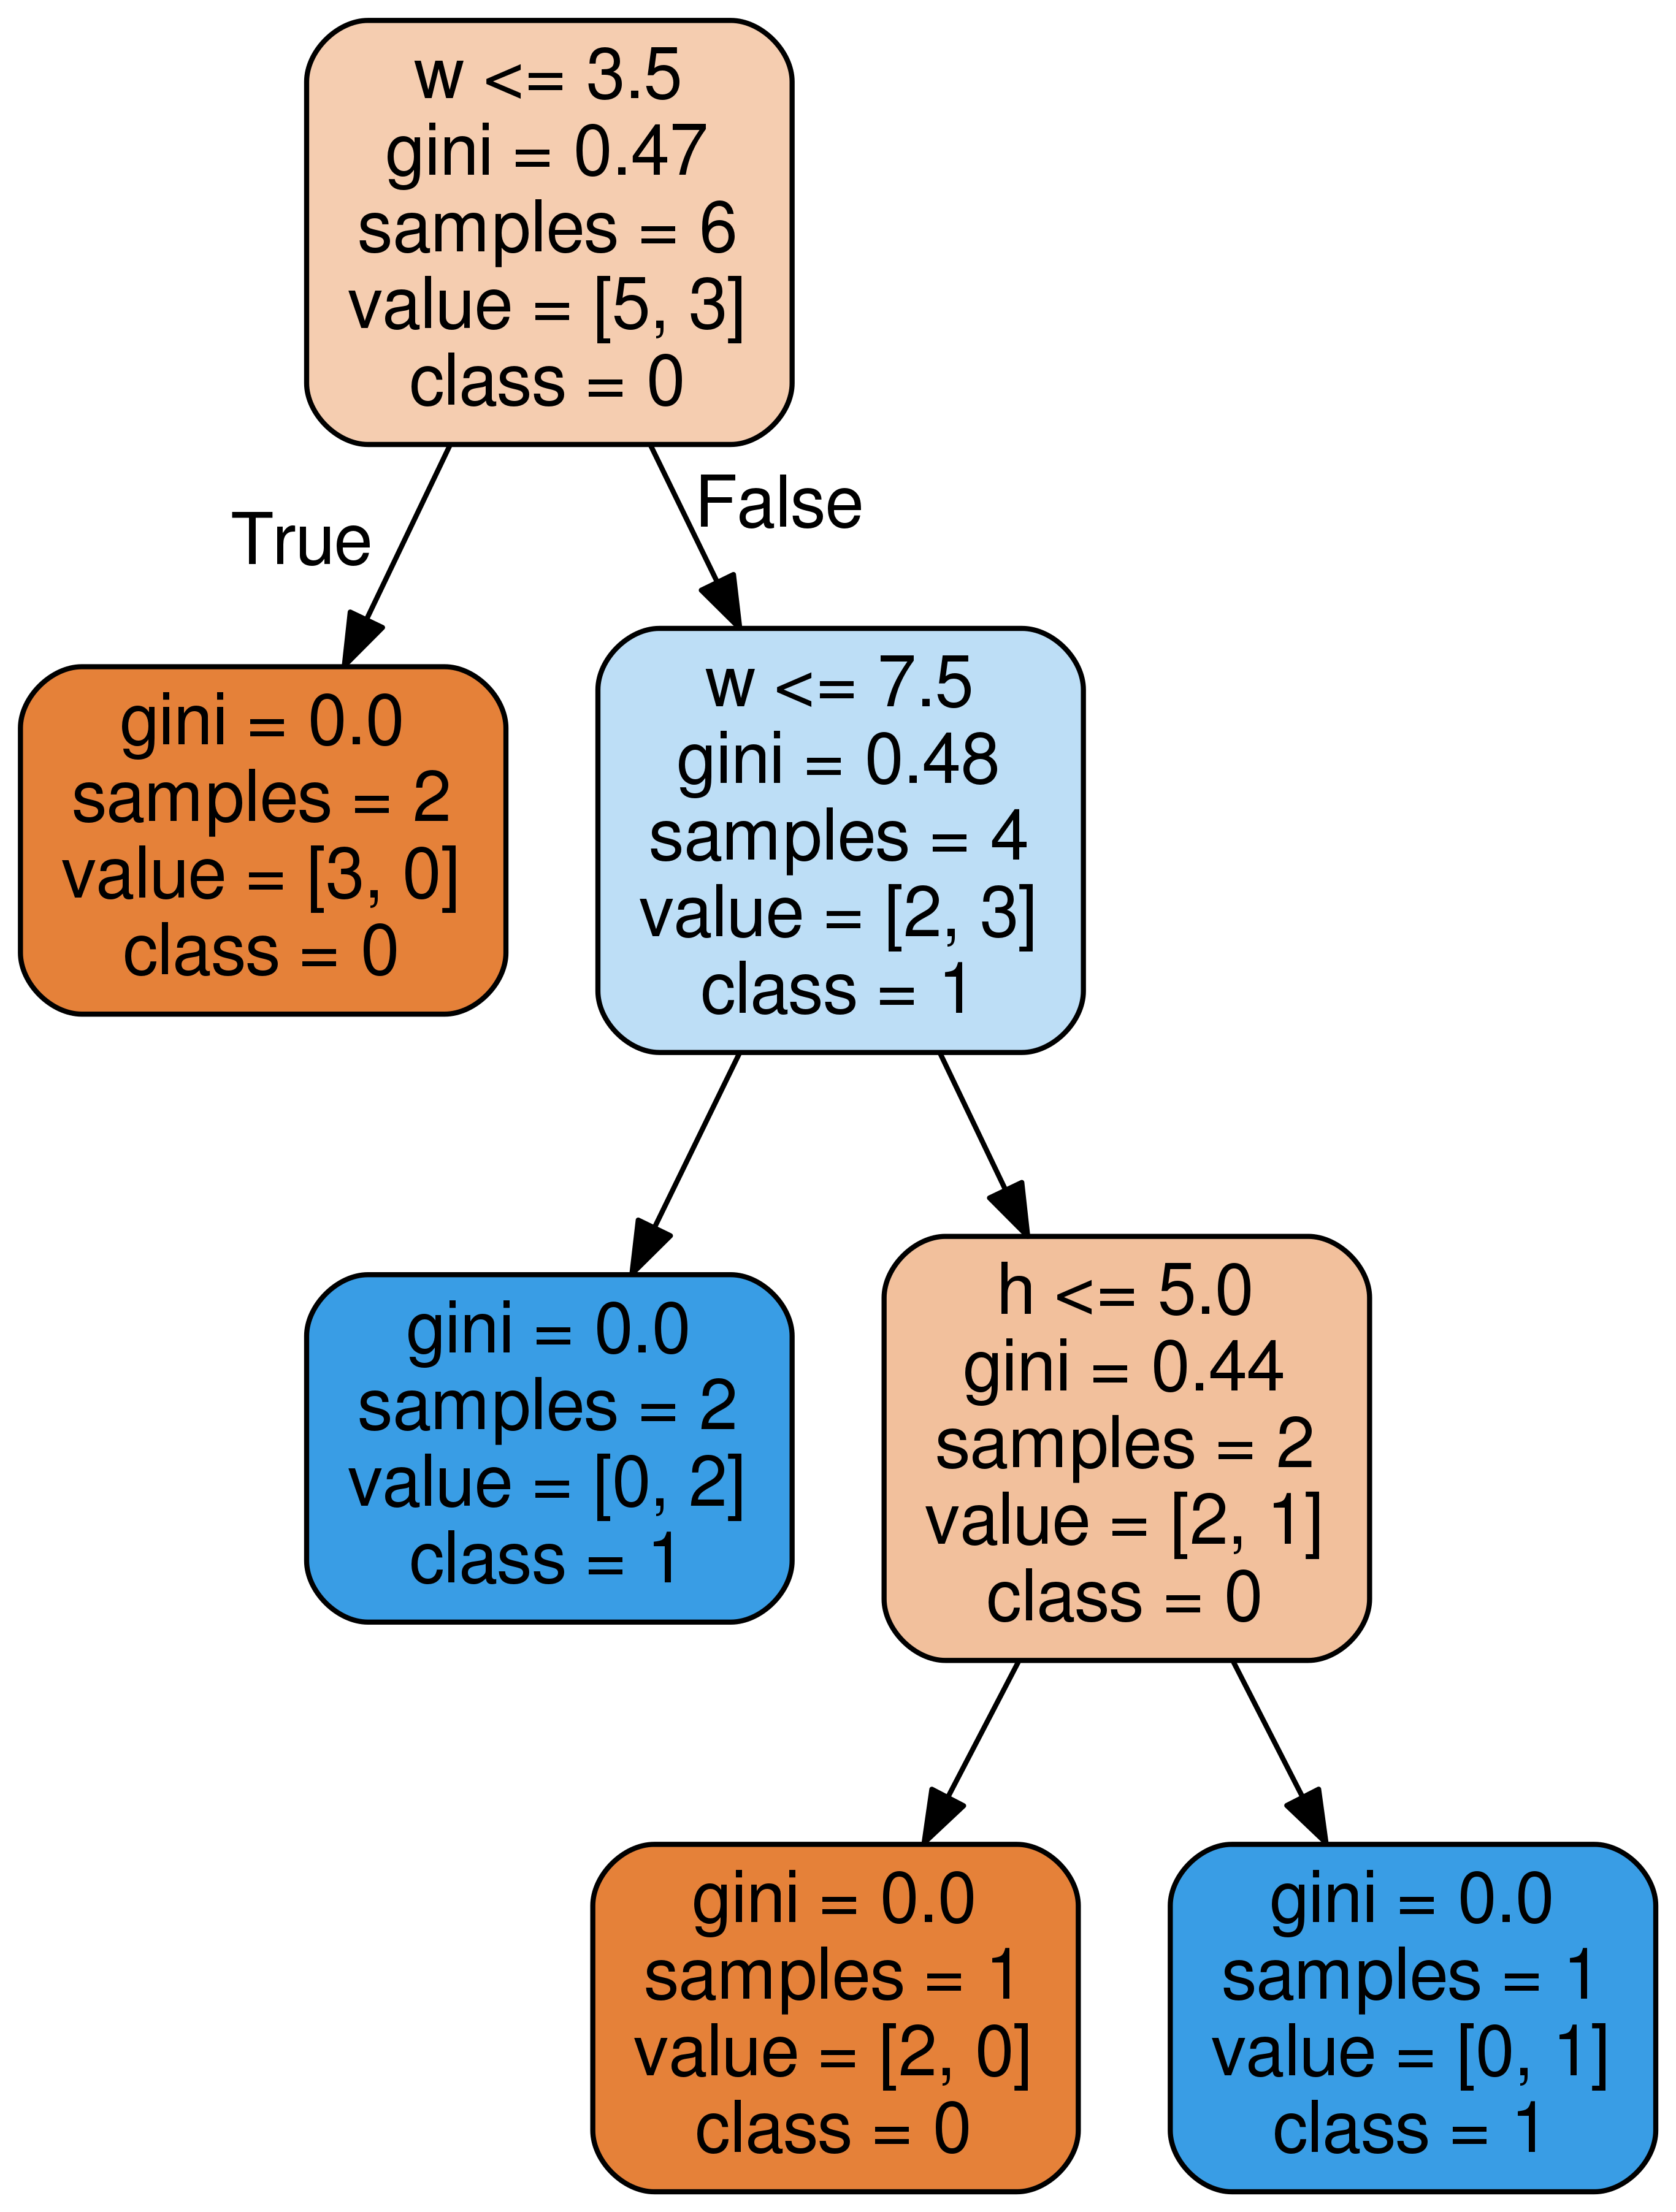
Each tree will be different in Random Forest. Here, we have plot only a single tree. We can also add a constraint to grow trees using the parameters of the Scikit-Learn Random Forest model such as max_depth, min_samples_leaf, etc. Please refer this documentation to understand the parameters thoroughly.